How Clera moved its service layer from 65 Supabase edge functions to one Node server on Google Cloud Run. It now handles 2,000+ requests a minute, and the cutover had zero downtime.
By Shlok Mundhra. This is part two of how we rebuilt Clera's infrastructure. Part one, how we migrated our 500 GB production database to ClickHouse Managed Postgres overnight, covers the database.
At the start of October, our backend handled 839,000 service calls a day, and nearly every one of them paid for a cold start. Almost half were our own services calling each other over HTTP. Four weeks later the same code ran as one Node server on Google Cloud. It now handles more than 2,000 requests a minute, peaks above 20,000, and we moved all of it without taking anything down.
Clera is an AI talent agent that works on both sides of the hiring market. We represent more than 200,000 candidates and help them get hired at mostly pre-seed to Series B companies in New York and San Francisco. Candidates talk to us over email, iMessage or chat. Companies get intros directly in their Slack, so there's no application step.
Under the hood, that's a multi-agent system: intake, matching, outreach, follow-ups. Every agent, every page on the site, both of our MCP servers and every background job sits on top of one service layer, with talents, jobs, messaging, matching and about sixty other domains, each behind a typed command. Moving the database fixed the bottom of the stack. This post is about the layer right above it, and why the way we ran it was slowing everything down.
Growing past our existing provider
Each of our services ran as its own Deno function on Supabase Edge, 65 of them by October. When we had ten, it was great. You deploy a folder and you have an endpoint. Nobody has to think about servers.
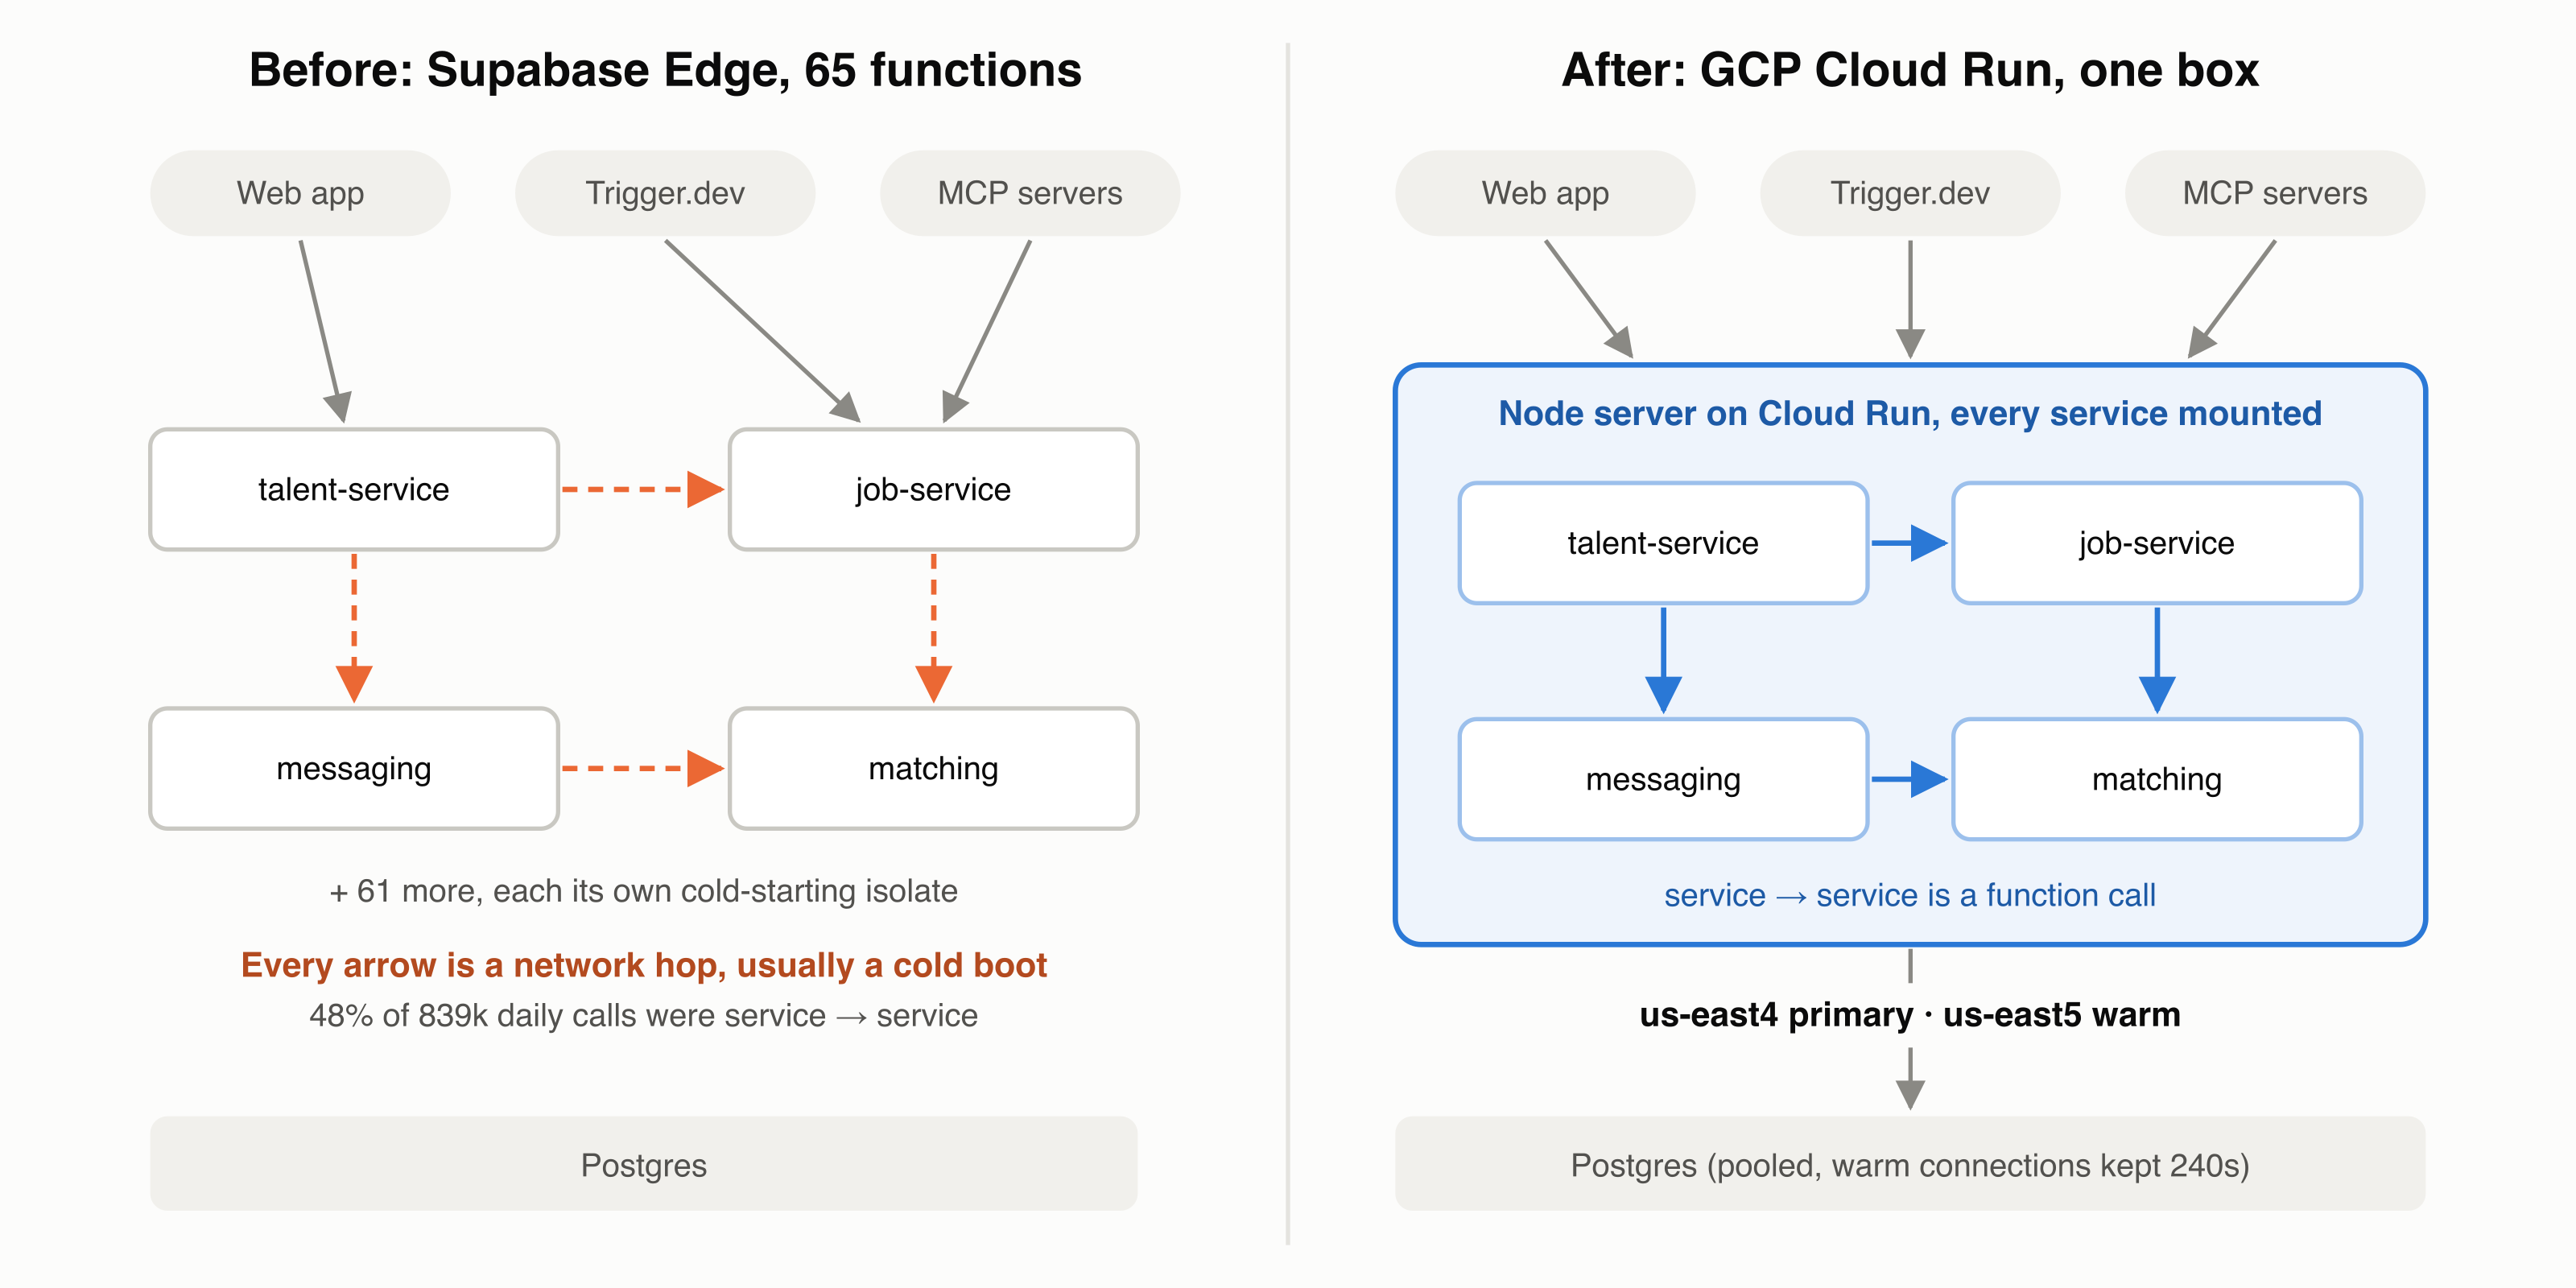
At 65, the cracks were all architectural. Edge functions spin up a fresh isolate when there isn't a warm one around, and with traffic spread across 65 functions there usually isn't. We measured 0.9 boots per request, with a median boot of 169 ms before a single line of our code ran.
Then we looked at who was calling, and the traffic broke into three types:
- Service to service (48%): one of our functions calling another. A single profile view could go talent → job → matching, paying for an HTTP round trip and usually a cold start at every hop.
- Background jobs and the web app (35%): Trigger.dev tasks and our Next.js routes calling in from outside.
- MCP and log shipping (about 9%): our agent tooling.
That first number was the real problem. Almost half of our traffic was our code talking to itself over the network. No amount of tuning makes that free, because the cost is built into running each service as its own function.
The smaller problems added up too. Our services ran on Deno, while the web app, Trigger.dev and our MCP servers ran on Node, so every shared package had to work in two runtimes with two module systems. A change to shared core code meant redeploying all 65 functions. Custom headers got lost on some calls between functions, so for close to half our traffic we couldn't reliably say who had called what. Heavy reads like our investor map ran into WORKER_RESOURCE_LIMIT, and there was no way to give one hot command more room. And EdgeRuntime.waitUntil, which keeps work running after the response goes out, gave us no signal on whether that work ever finished.
If you've run a lot of edge functions, you'll know the feeling. Nothing is on fire, but everything is a bit slower and a bit harder to see than it should be. We wanted one warm process where calling another service is just a function call.
Choosing the right cloud provider
This wasn't a case of picking the cloud we liked. We started from three hard requirements and let them rule things out.
The first was one long-lived process. Every service had to live in the same Node server, so a call between services is in-process, with no serialization and no hop. That ruled out anything built on functions, so we were choosing between container platforms.
The second was fast deploys: build once per commit, then promote that same image region by region, with deploys measured in minutes.
The third was zero downtime, not even a second, both during the migration and on every deploy after it.
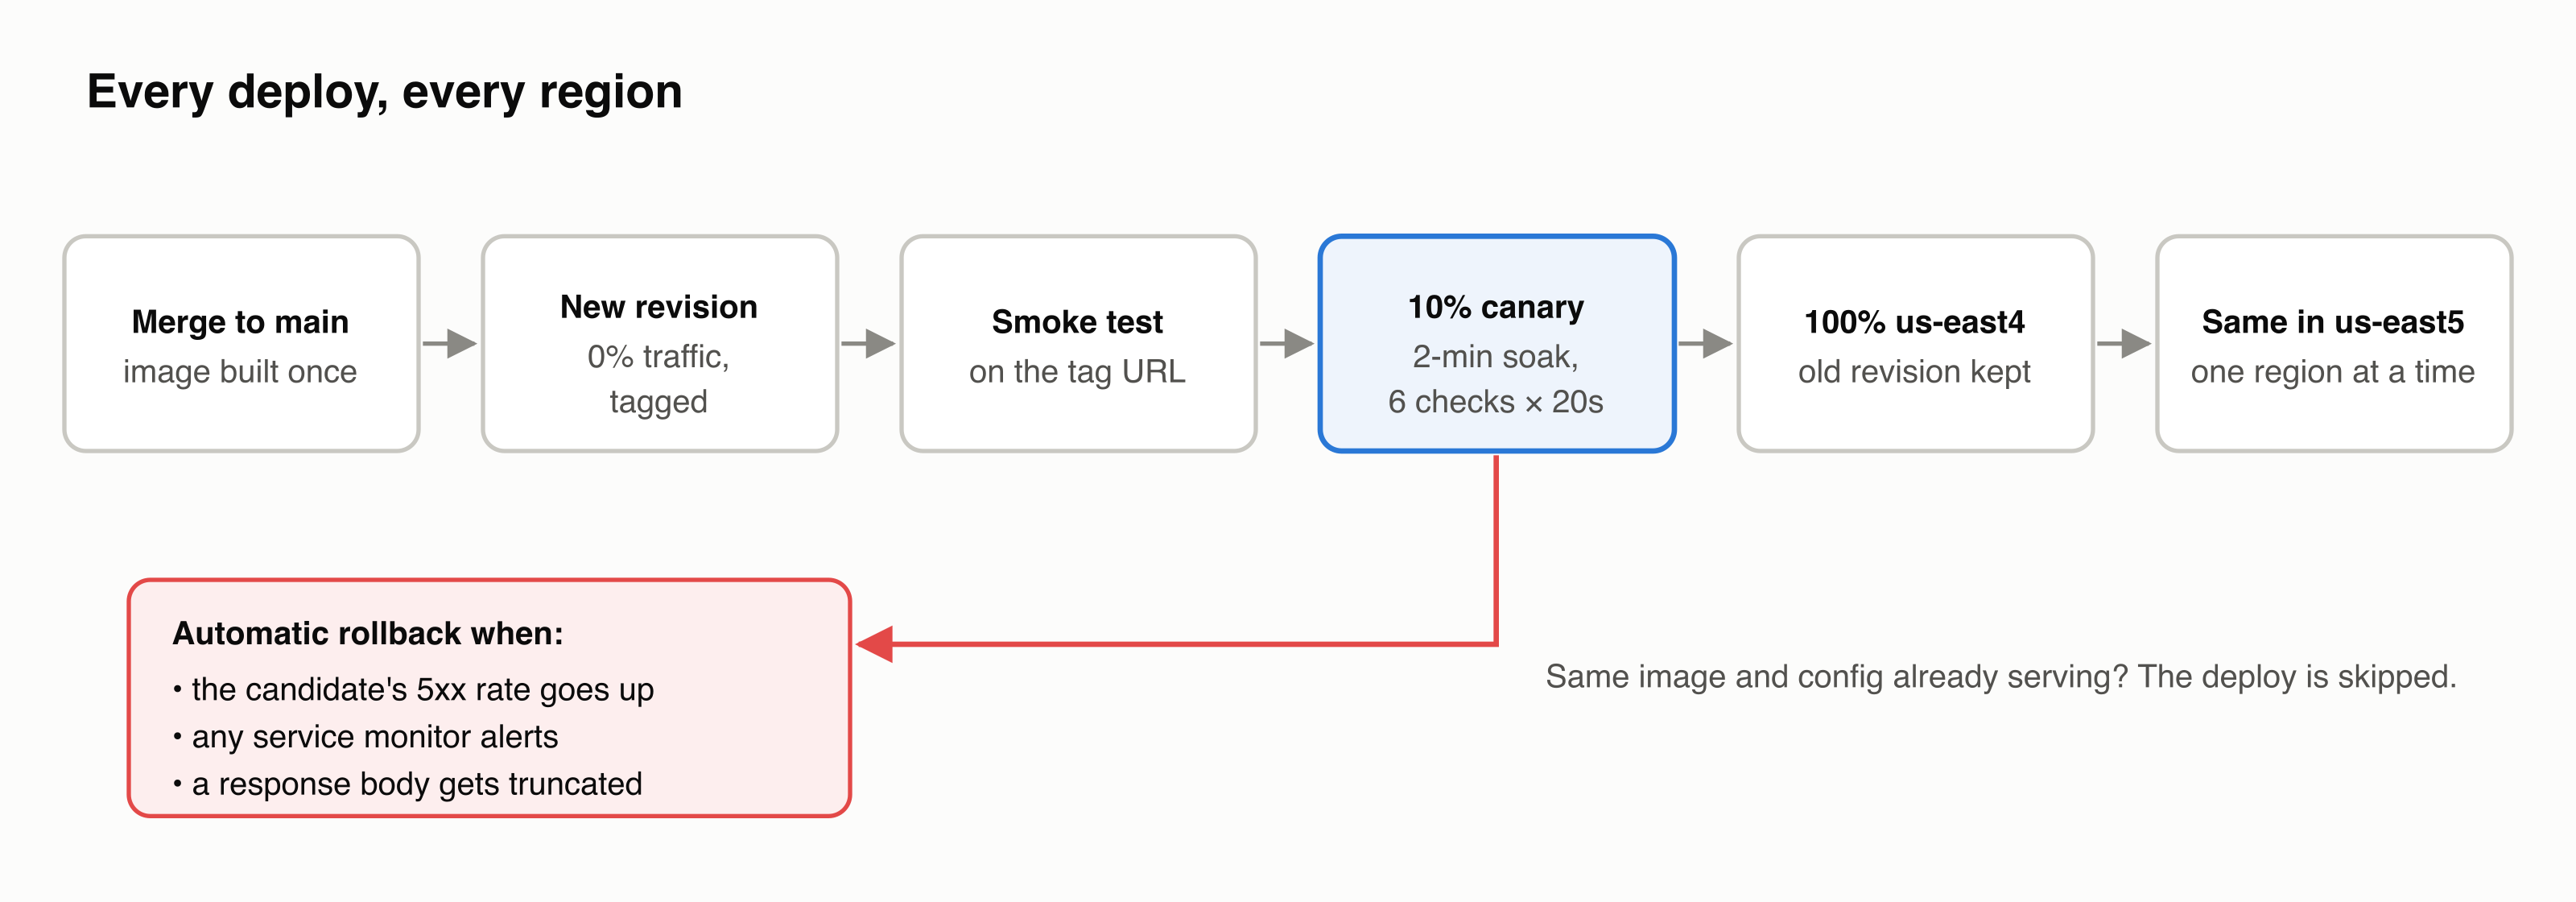
That left two serious options: AWS ECS on Fargate, or Google Cloud Run. Cloud Run won on rollout. Every deploy creates an immutable revision. You can create it with no traffic, give it its own tagged URL, smoke-test it there, send it 10% of real traffic, and then promote it. Rolling back means pointing traffic at the previous revision, which is still warm. On ECS we could have built all of that from task definitions, target groups and weighted listeners, but on Cloud Run it's what a deploy already is. We also already ran our MCP servers on Cloud Run, so the Terraform, the container registry and the deploy identity existed.
Measuring regions against the database
Here's the part that made people raise an eyebrow: our Postgres runs on AWS, in us-east-1. Putting the compute on Google meant every query would cross from one cloud to another. Whether that's fine isn't something you can read off a map, so we measured it.
We ran a small Cloud Run job in each candidate region and timed real queries against production through the connection pooler.
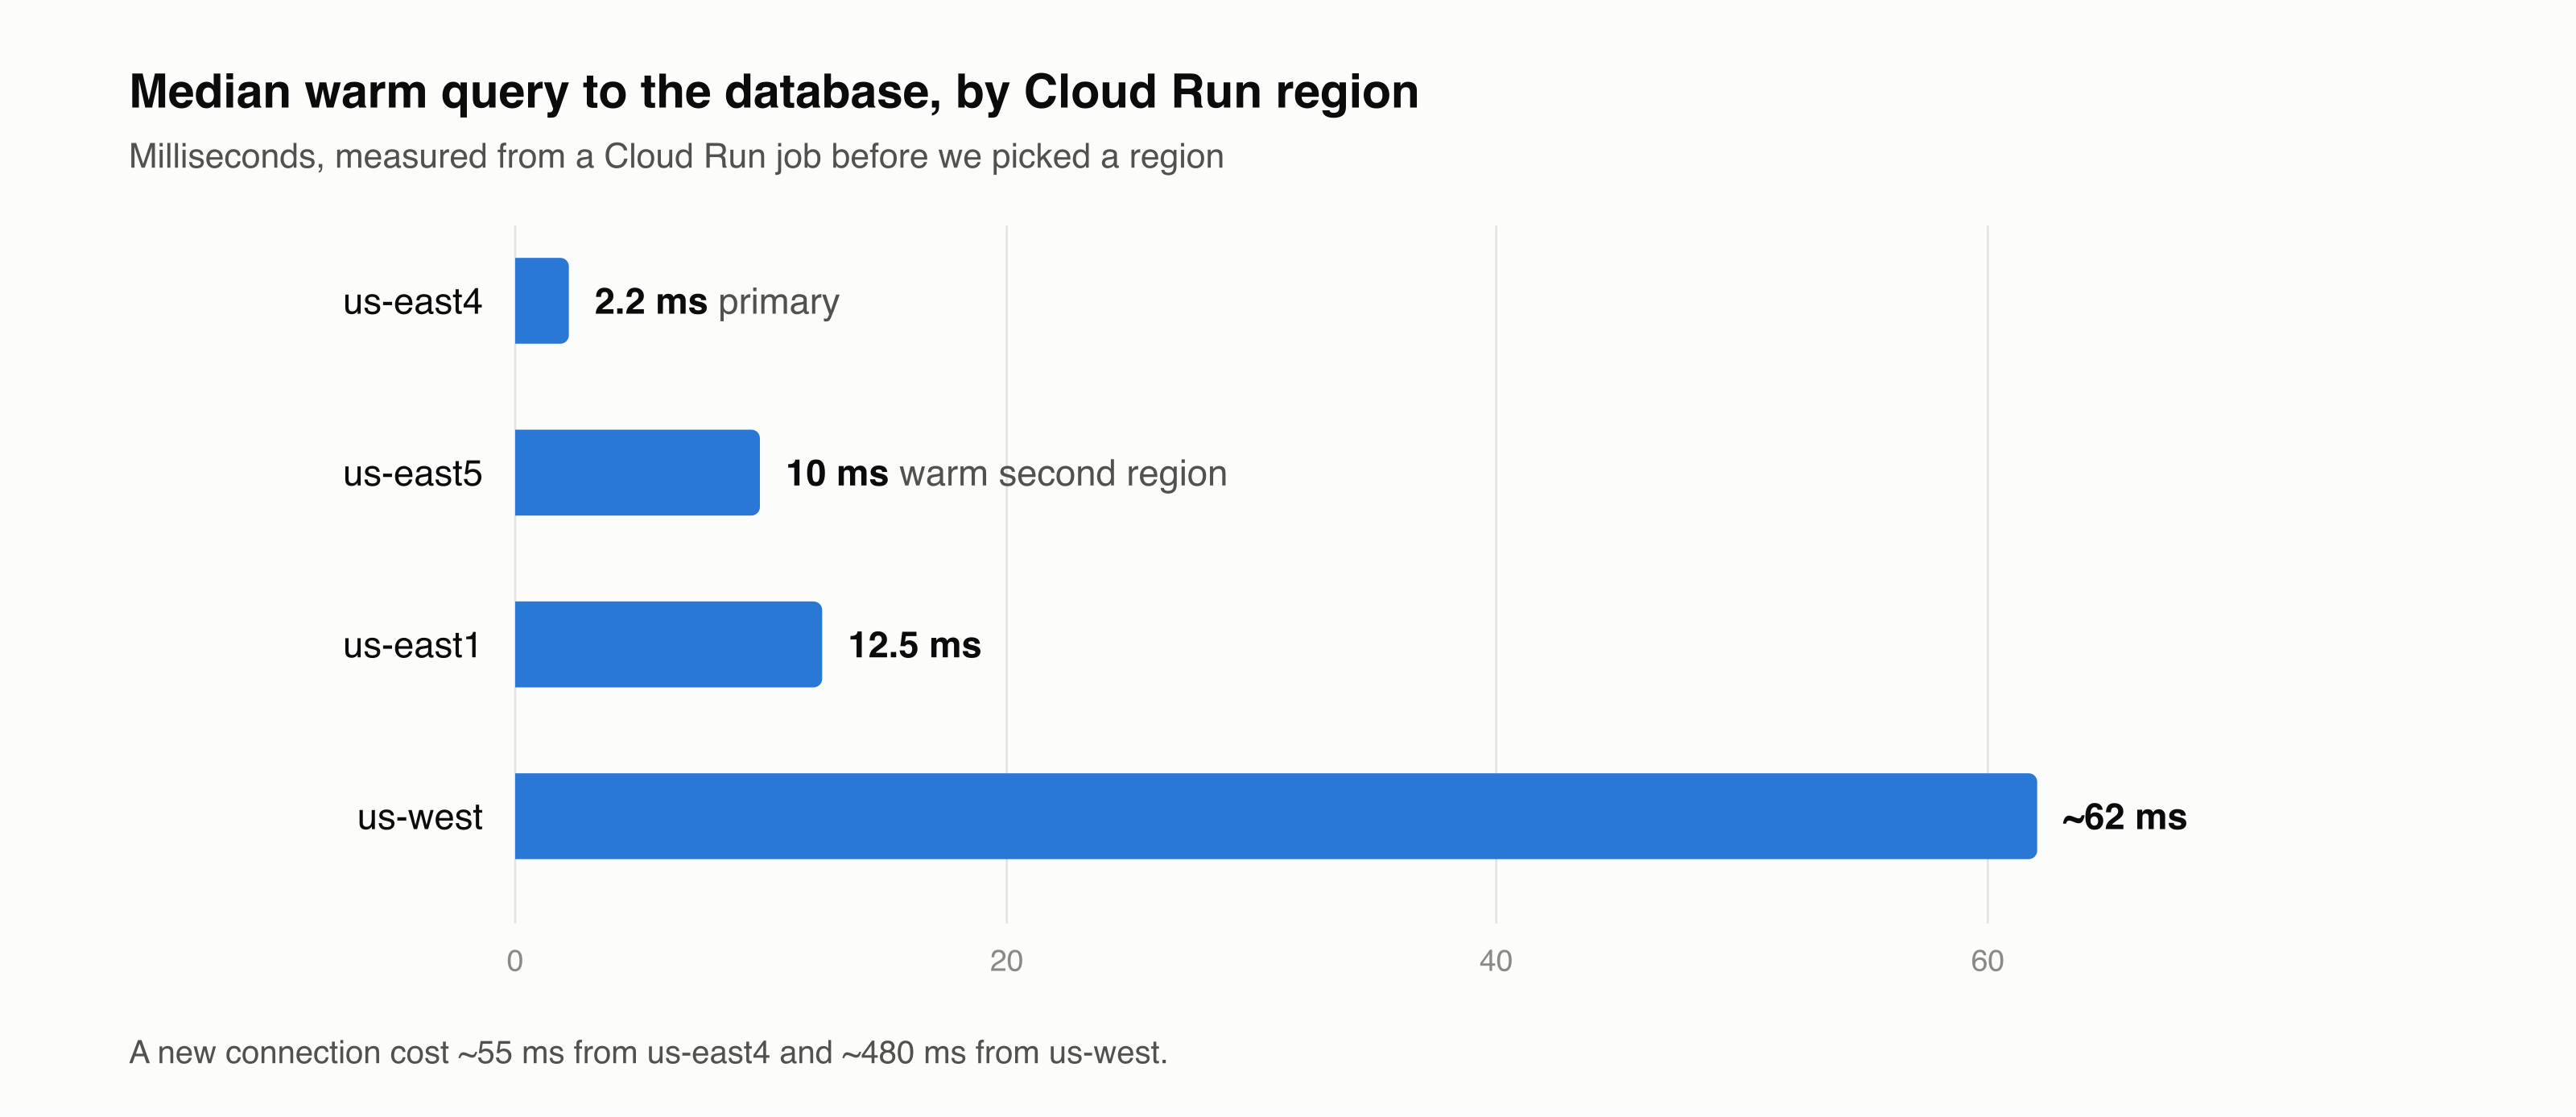
From us-east4 (northern Virginia), a warm query came back in 2.2 ms at p50 and 3 ms at p99, and a new TLS connection took about 55 ms. That's faster than a single edge cold boot. The us-west regions took around 62 ms per query and close to half a second to open a connection, so they were out immediately. For the second region we picked us-east5 over us-east1, because it measured closer to the database: 10 ms against 12.5 ms.
The load balancer had its own catch. On Google's global load balancer, serverless backends have no failover policy, so you can't configure "primary plus standby". We run both regions active-active instead, and each request goes to the nearest healthy one.
We were also honest with ourselves about the limits. The database lives in one region, so two regions of compute make the box fail over faster, but they don't make us more available than Postgres underneath it. And Cloud Run cuts any request off at 900 seconds. That was fine, because anything that long already belonged in a background job.
Migrating (The D-day)
One decision made the whole migration possible: we didn't change the API. Every caller already went through a typed client, something like TalentService.profile.get(...), that turned into a POST /functions/v1/<name> request. The new server, which we call the services box, serves exactly the same route. Moving a caller meant changing a base URL. Inside the box, the client notices its target is itself and calls the handler directly.
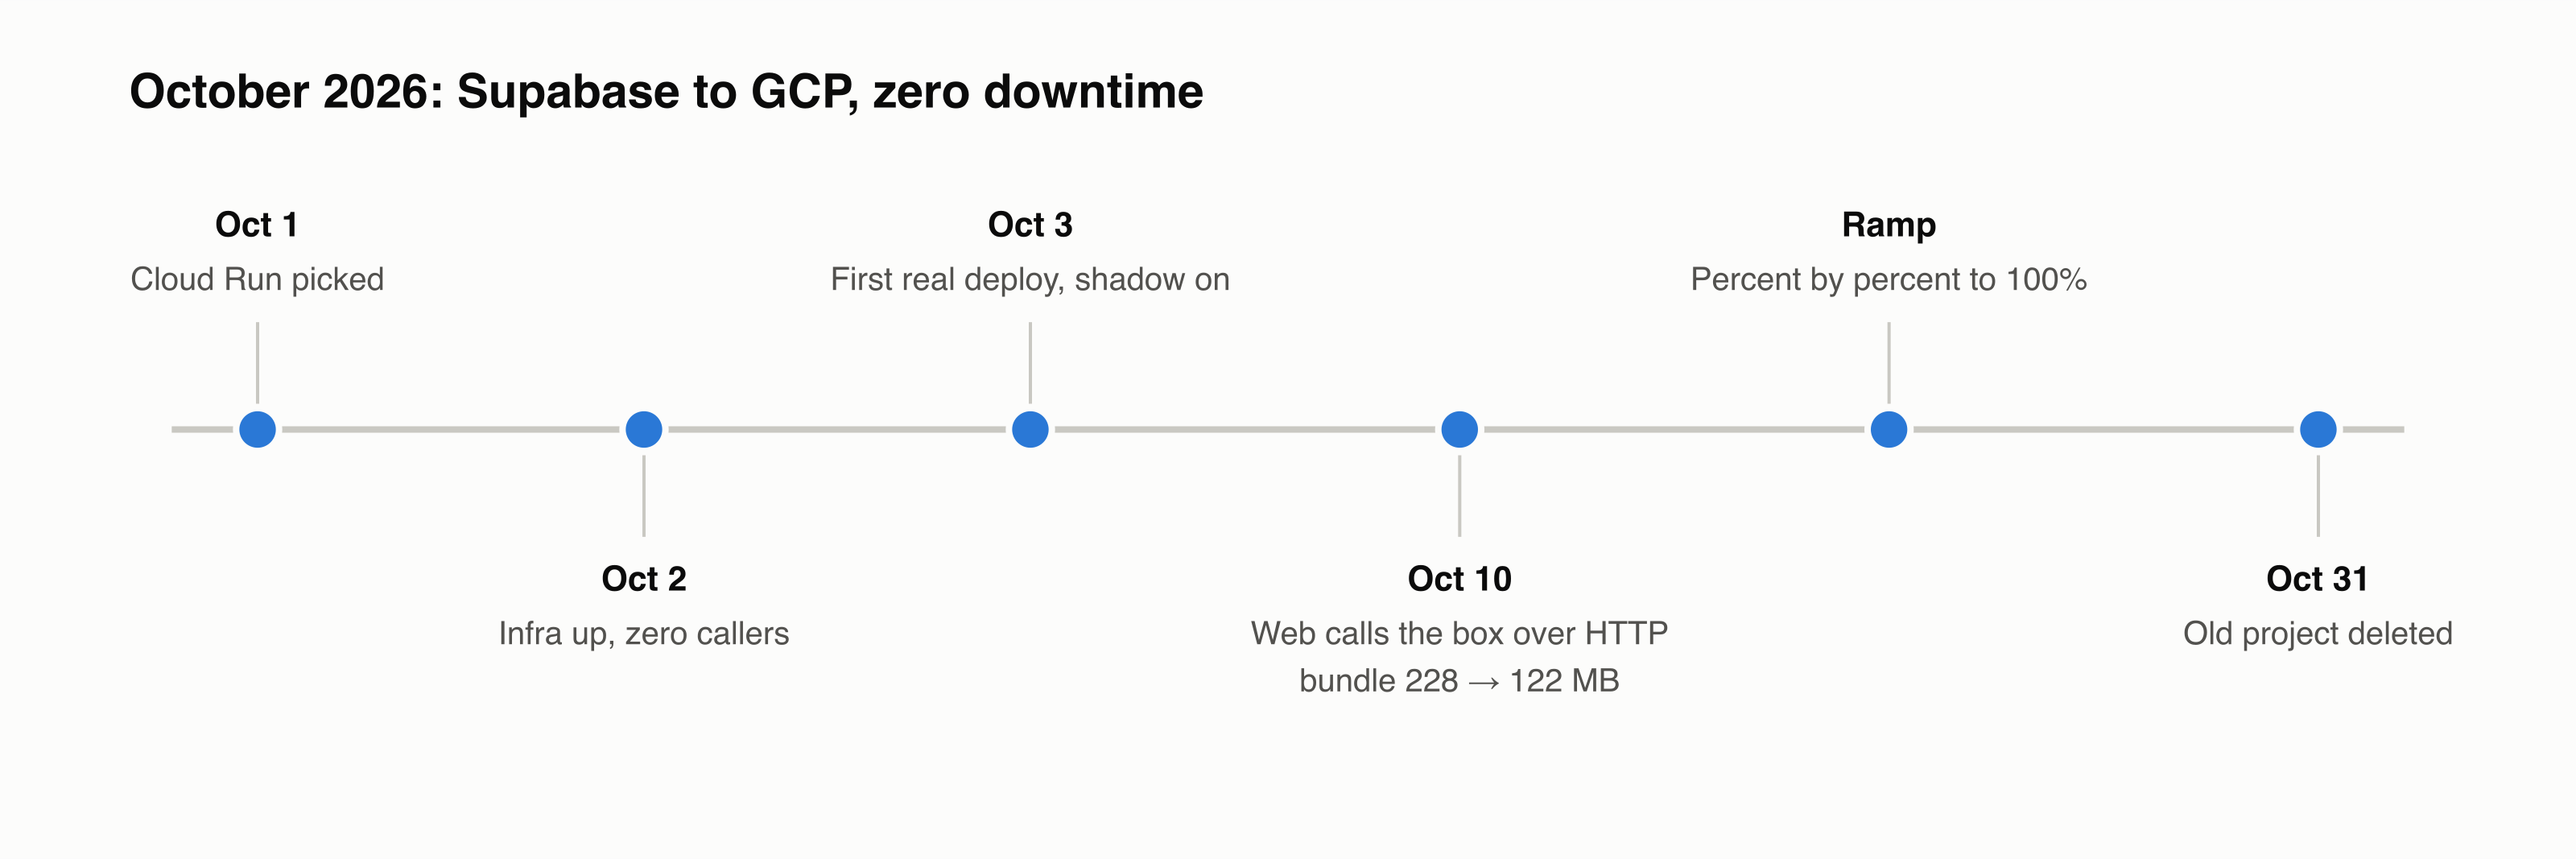
We picked Cloud Run on October 1. On October 2, Terraform stood up 206 resources across both regions: the Cloud Run services, the load balancer, Cloud Armor, certificates, the container registry, service accounts and secrets. Both regions came up healthy on a placeholder image, with zero callers.
The certificates went active at 00:34 UTC on October 3. Six minutes later the first real build went out through the deploy pipeline, the same one every deploy still uses.
Around 01:00 UTC we turned on shadow traffic. Every internal caller kept talking to Supabase as normal, but also sent a copy of its read commands (get, list, exists) to the box, so we could compare the answers without risking anything. In the first two and a half hours the box took 1,419 mirrored requests, and every one came back 200. The web app started shadowing at 03:31 UTC.
The hard part wasn't the infrastructure. It was working out what counts as a read. We found 92 commands named like reads that actually wrote something. 44 of them were analytics queries that wrote their results to a cache. Mirror those and you get double writes, so they went on a denylist, by hand, one at a time. We learned not to trust a command's name to tell us what it does.
After that, real traffic moved over a percent at a time. Callers read the routing percentage at runtime, so turning it back down never needed a deploy. On October 10 the web app made the biggest single move: about 1,000 API routes and loaders stopped running service code inside Next.js and started calling the box over HTTP, each request carrying a signed identity token the box verifies.
Once everything was at 100%, we deleted the ramp and the fallback to Supabase. That sounds scary, but keeping it would have been worse. If a failed request can be replayed on a second backend, one write can end up running twice in two places. Now a failure on the box stays on the box. Connection errors and 502/503/504s are retried against the box itself, three attempts with backoff. For writes that aren't idempotent, that retry is a risk we know about and accepted.
Moving from Deno to Node exposed a few problems the old runtime had been hiding, and none of them threw an error. EdgeRuntime?.waitUntil(...) simply doesn't exist in Node, so code that called it quietly skipped its background work. Our outbox had been marking events as delivered before the listener had actually finished with them. And after launch, renaming a command broke one of our MCP servers for the five minutes before it redeployed. Each of those now has a guard in CI or in the deploy process.
On October 31 we deleted the Supabase project.
With the numbers
- 65 → 1: Supabase Edge functions to one Node server on GCP Cloud Run
- 0 downtime during the cutover
- 839k → ~4.2M requests a day
- 2,000+ requests a minute, about 2,900 on average, with peaks above 20,000
- 0.9 → 0 cold boots per request on a warm instance
- 48% of calls moved from network hops to function calls
- 2.2 ms p50 warm query from us-east4 to AWS us-east-1
- 206 Terraform resources to stand up two regions
- 1,419 / 1,419 shadow requests returned 200 on the first night
- 228 MB → 122 MB web serverless function
- 4 weeks from first deploy to deleting the Supabase project
How our system improved
The biggest change is where latency comes from. There are no isolate boots and no hops between our own services any more, so a request is mostly our code and the database. The box keeps pooled database connections open for 240 seconds, because opening a new one through the pooler costs up to a second, against about 65 ms on a warm one.
We also run one runtime now. Services, the web app, Trigger.dev and both MCP servers are all Node, so a shared package only has to work one way.
The box now handles about 4.2 million requests a day, roughly five times what the edge functions saw in October, still on the same two regions. Part of that jump is traffic that used to be invisible. The web app ran service code inside its own function, so those calls never showed up as requests. Now everything goes through one front door, and we can see all of it.
That visibility is the improvement the team feels most. Every request logs who called it and how long it took. Each instance reports event-loop lag, heap usage and how many queries are waiting for a database connection, every ten seconds. Every background task logs when it finishes and whether it succeeded. When something is slow, we can see where.
The web app got lighter too. With service code out of Next.js, our serverless function dropped from 228 MB to 122 MB, after growing by 1 to 2 MB a day.
Deploys are boring now, which is the goal. Every revision starts at 0%, gets smoke-tested, and soaks at 10% for two minutes. It rolls back on its own if errors go up or a monitor fires.
What we haven't done yet is a proper before-and-after latency comparison for user-facing pages. The hops are gone, and we'd rather publish that number once we've measured it properly than guess.
Frequently Asked Questions
Each service ran as a separate edge function, so 48% of our calls were our own services talking to each other over the network, and 0.9 of every request paid for a cold start. Running everything in one warm Node server on Cloud Run turned those hops into function calls.
Cloud Run already does what a zero-downtime rollout needs: immutable revisions, deploys with no traffic, tagged preview URLs and percentage-based traffic splitting. On ECS we'd have built that ourselves, and on Kubernetes we'd be running a cluster.
We measured it before committing. From us-east4, a warm query to our Postgres in AWS us-east-1 takes 2.2 ms at p50, faster than one edge cold boot used to take.
Nothing switched in one step. The box took mirrored read traffic first, then real traffic a percent at a time through a routing value we could change at runtime. We only removed the fallback once everything was at 100%.
About 4.2 million requests a day, averaging around 2,900 a minute and peaking above 20,000, served from us-east4 and us-east5.
Nothing users noticed. Internally, Deno-only APIs silently did nothing under Node, an outbox race became visible, and one command rename broke an MCP server for five minutes. All three now have guards.